Direct and complex supply chains
As a food retailer, our supply chains vary depending on product type, the origin of raw materials and the number of actors involved. In general, supply chains can be classified as either direct or complex.
Direct supply chains are characterised by a relatively simple structure, with fewer intermediaries across the value chain. In these cases, raw materials are usually sourced directly from producers, processors or first‑tier suppliers (Tier 1). Because the flow of raw materials involves fewer steps, traceability is simpler and the supply chain can be easily monitored back to the farm or production unit.
In contrast, complex supply chains involve multiple tiers and intermediaries, including traders, aggregators, processors, importers, manufacturers and brand owners. Due to the involvement of many actors, complex supply chains are inherently more intricated. As a result, traceability becomes more difficult, particularly in upstream activities such as land use change, harvesting or feed production. Information about the origin of raw materials may become incomplete or diluted as products move along the value chain.
Regarding our direct supply chains, and for each of the relevant commodities with deforestation risk, we consider the following assumptions:
Palm oil – Products containing crude or refined palm oil, as well as palm kernel oil, as an ingredient.
Soy – Products containing a minimum of 5% soy. According to the CGF Soy Measurement Ladder, the following categories are included:
Tier 1: Products in which soy and soy derivatives purchased directly (e.g., soy drinks, soy sauces, soybean oil, edamame) exceed 95% of its composition.
Part of Tier 5: Products in which soy or soy derivatives may be indirectly present, including soy lecithin in chocolate, soybean oil in margarine and soy by‑products in cosmetics and personal care items, where soy represents between 5% and 95% of total product composition.
Paper/timber: All products containing paper or timber as an ingredient.
Beef: Products containing a minimum of 5% beef.
In turn, complex supply chains can be categorised as follows:
Palm oil: Products containing palm‑oil derivatives or other fractions as ingredients.
Soy: Products containing animal protein derived from animals fed with soy, as well as products containing less than 5% soy as an ingredient. According to the CGF Soy Measurement Ladder, the following are included:
Tier 2: Soy used in feed for animals such as cattle, pigs, poultry, aquaculture fish and other species, including fresh meat and fish products.
Tier 3: Soy used in the feed of laying hens, dairy cows and other milk‑producing animals, applied to products such as eggs and dairy (e.g., milk, yoghurts or milkshakes), where these account for than 95% of the final product.
Tier 4a: Soy used in the feed of animals whose meat is incorporated into processed food products (such as ready meals, sausages, etc.), where meat or fish represents less than 95% of the final product.
Tier 4b: Soy used in the feed of animals whose meat is incorporated into food products, such as cakes, smoothies and ice creams, and for which eggs and dairy account for less than 95% of the final product.
Part of Tier 5: Soy or soy derivatives that may be present in the supply chain, including soy lecithin in chocolate, soybean oil in margarine, and soy by‑products in cosmetics and personal‑hygiene products, in which soy represents less than 5% of the final product.
Paper/timber: Primary, secondary and tertiary packaging containing virgin paper fibres used for products sold in our stores.
Beef: Products containing more than 5% beef.
Main agricultural commodities with deforestation risk
The sourcing and consumption of key agricultural commodities, such as those identified as having higher deforestation exposure, require careful monitoring. Understanding the presence and impact of these main agricultural commodities within our operations is essential to manage environmental impacts, strengthen responsible sourcing practices and contribute to the protection of natural ecosystems.
Into the forest
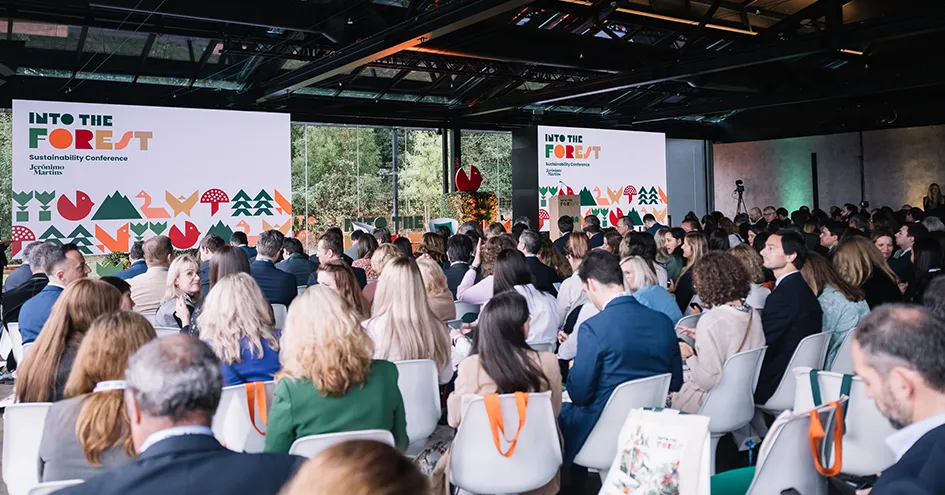
In October 2025, we held a Sustainability Conference dedicated to forests, highlighting the vital role these ecosystems play in our lives and in food retail. Under the theme “Into the Forest”, the event brought together national and international experts in Lisbon, such as Stefano Mancuso, Michał Zazada and Mark Plotkin, to discuss solutions to address deforestation. Through a series of dedicated panels focusing on the commodities most associated with deforestation – palm oil, soy, beef and paper/timber, as well as coffee and cocoa – we outlined, together with some of our suppliers, the measures we have put in place to source these commodities more responsibly.
The data indicates a broadly stable profile in the use of key agricultural commodities associated with deforestation risk in 2025 compared to 2024, with variations largely reflecting changes in product mix and operational dynamics. While palm oil and paper/timber volumes increased, including in packaging, beef and total soy remained relatively stable, with soy showing a degree of internal rebalancing between direct and indirect sourcing. As indirect soy continues to represent most of the exposure, this underscores the structural characteristics of the commodity and the importance of ongoing traceability, supply chain management efforts and collective action.
|
|
Total quantity (tonnes) |
||||||||||
|---|---|---|---|---|---|---|---|---|---|---|---|---|
Main agricultural commodities with deforestation risk in Private Brand and perishables |
|
2025 |
|
2024 |
|
Δ 2025/2024 |
||||||
Palm oil |
|
92,473 |
|
77,667 |
|
19.1% |
||||||
Soy |
|
511,370 |
|
513,486 |
|
-0.4% |
||||||
Soy (direct) |
|
7,985 |
|
21,061 |
|
-62.1% |
||||||
Soy (indirect)1 |
|
503,385 |
|
492,425 |
|
2.2% |
||||||
Paper/timber |
|
234,120 |
|
212,152 |
|
10.4% |
||||||
Paper/timber (products)2 |
|
185,111 |
|
170,751 |
|
8.4% |
||||||
Paper/timber (packaging)2 |
|
49,009 |
|
41,401 |
|
18.4% |
||||||
Beef |
|
40,895 |
|
40,337 |
|
1.4% |
||||||
|
||||||||||||
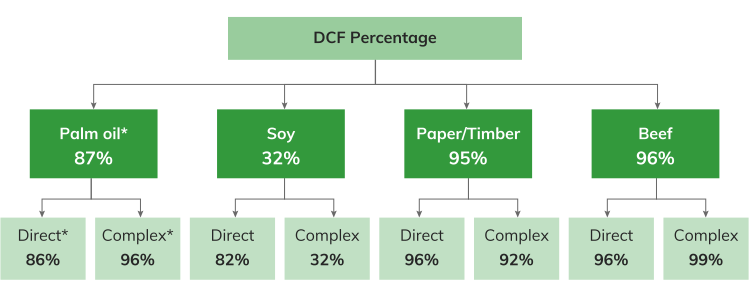
Given the structural differences between direct and complex supply chains, the outcomes of implementing DCF commitments can vary significantly. In direct supply chains, closer proximity to suppliers and greater operational visibility enable faster and more consistent progress towards DCF, supported by higher levels of traceability and control – this is the case with palm oil, paper/timber and beef. By contrast, soy supply chains are characterised by multiple intermediaries, geographically dispersed origins and limited upstream verification capacity – meaning that the results tend to be more variable and harder to consolidate.
|
|
Total quantity (tonnes) |
|---|---|---|
Direct and complex supply chains by commodity |
|
2025 |
Palm oil |
|
92,473 |
Direct chain |
|
81,323 |
Complex chain |
|
11,150 |
Soy |
|
511,370 |
Direct chain |
|
5,972 |
Complex chain |
|
505,398 |
Paper & Timber |
|
234,120 |
Direct chain |
|
185,111 |
Complex chain |
|
49,009 |
Beef |
|
40,885 |
Direct chain |
|
39,347 |
Complex chain |
|
1,548 |
Countries with higher deforestation and HCV ecosystem conversion risk in our supply chain
Commodities
Click to explore
Palm Oil
Colombia, Ecuador, Malaysia, IndonesiaAs the largests palm oil producers in the world, Indonesia and malaysia depend heavily on this industry for economic development, but its expansion has been associated with severe forest loss and environmental damage. Colombia stands as the largest producer in Latin America, with less than 1% of the country’s deforestation attributed to the palm oil production.
How we manage this commodity?
We increased the traceability of this commodity, highlighting progress in Colombia, where we are now able to trace palm oil down to the plantation level (targeting 94% by 2025). In our European operations, where Southeast Asia plays a relevant role in sourcing, we achieved 100% RSPO-certified palm oil in Private Brand and perishable products.
Soy
Brazil, Argentina, ParaguayAround 80% of global soy production is concentrated in Brazil, the United States, and Argentina. Soybeans are used both in food production and in non-food applications. Nevertheless, the majority is destined for animal feed.
How we manage this commodity?
We have improved traceability of soy in our supply chain, particularly in indirect consumption (such as animal feed). The share of soy with unknown origin was reduced from 30% in 2020 to 3% in 2025.
Paper & Timber
Indonesia, United States, VietnamPaper production depends on cellulose extracted from wood. Indonesia is a major global timber producer, with forestry playing an important role in rural livelihoods and global wood supply.
How we manage this commodity?
We increased the FSC® and PEFC certification of the virgin fibres used in our products and packaging from 65% (in 2020) to 92% (in 2025). In the case of paper and timber used in packaging, around 79% of the fibres are recycled.
Beef
Brazil, Argentina, Colombia, United StatesBeing the the world’s largest beef exporter, supplying major international markets, the Amazon rainforest in Brazil faces significant deforestation pressures, with cattle pasture expansion as the major responsible for roughly the damage.
How we manage this commodity?
Although our risk exposure to this ingredient is very limited (around 4% of our consumption), we have ensured traceability for all high-risk origins up to the slaughterhouse level and strengthened oversight of suppliers located in states and municipalities associated with deforestation.
Cocoa
Côte d'Ivoire, Ghana, Cameroon, Colombia, NigeriaCocoa is the backbone of the west africa economy, supporting millions of smallholder farmers and rural livelihoods. The region produces around more than half of global cocoa, making it the world’s top supplier.
How we manage this commodity?
We were able to ensure traceability of 80% of the cocoa incorporated into Private Brand and perishable products to the country of origin.
Coffee
Vietnam, Brazil, Ecuador, Colombia, IndonesiaRobusta coffee production in Vietnam is one of the world's largest crops. However, the sector faces growing challenges from climate change and global demand.
How we manage this commodity?
For coffee, 98% of the volume in private label and perishable products was also traced back to its country of origin.
DCF status
The calculation of our consumption of these raw materials, as well as the volumes considered DCF, is based on non-conversion and deforestation cut-off specific dates for each agricultural commodity. The following criteria are applied:
Negligible risk – Primary production is considered DCF in countries where the risk of deforestation and land conversion is classified as negligible.
Certification – In countries identified as having a risk of deforestation and land conversion, volumes are considered DCF when covered by recognised physical certification schemes up to the Mass Balance level (excluding the purchase of credits).
Monitoring – In countries identified as having a risk of deforestation or conversion, verified DCF control and monitoring mechanisms, either remote or on-site, must be in place to ensure traceability and verification of non-conversion or non-deforestation down to plantation level after the cut-off date established for each commodity.
Additional information
The specific cut-off dates for each commodity are indicated in their respective sections. The FPCoA also provides detailed information on the DCF methodology applicable to palm oil, soy, paper/timber and beef, as well as the list of countries where the risk of deforestation and conversion is considered negligible.
In the chart below, the DCF percentages are outlined by value chain, clearly illustrating the differences in risk exposure between direct and complex chains for each commodity. This analysis enables us to understand and prioritise different traceability, verification and mitigation strategies tailored to the specific complexity of each supply chain.